 Original Article

Affiliation:
1Republican Specialized Scientific and Practical Medical Center of Cardiology, Tashkent 100052, Uzbekistan
ORCID: https://orcid.org/0009-0009-7116-9755
Affiliation:
1Republican Specialized Scientific and Practical Medical Center of Cardiology, Tashkent 100052, Uzbekistan
Email: ranoalieva@mail.ru
ORCID: https://orcid.org/0000-0003-3936-0815
Affiliation:
1Republican Specialized Scientific and Practical Medical Center of Cardiology, Tashkent 100052, Uzbekistan
ORCID: https://orcid.org/0000-0001-6171-7652
Affiliation:
1Republican Specialized Scientific and Practical Medical Center of Cardiology, Tashkent 100052, Uzbekistan
ORCID: https://orcid.org/0000-0003-2354-1785
Affiliation:
1Republican Specialized Scientific and Practical Medical Center of Cardiology, Tashkent 100052, Uzbekistan
ORCID: https://orcid.org/0009-0003-4640-9936
Affiliation:
2Tashkent Medical Academy, Tashkent 100169, Uzbekistan
ORCID: https://orcid.org/0000-0001-5520-675X
Affiliation:
2Tashkent Medical Academy, Tashkent 100169, Uzbekistan
ORCID: https://orcid.org/0000-0002-3989-1985
Explor Cardiol. 2025;3:101260 DOl: https://doi.org/10.37349/ec.2025.101260
Received: March 26, 2025 Accepted: May 26, 2025 Published: June 11, 2025
Academic Editor: Cristina Sena, University of Coimbra, Portugal
Aim: Coronary heart disease (CHD) has been the leading cause of death worldwide for several decades. Non-alcoholic fatty liver disease (NAFLD), the most common liver pathology, is considered a risk factor (RF) for the development of CHD and a predictor of an unfavourable prognosis. Our study aimed to compare cardiometabolic parameters in patients with CHD with and without NAFLD.
Methods: The study prospectively included 85 patients with CHD, 61 with NAFLD (group I) and 24 without NAFLD (group II). In both groups, a comparative analysis of RF, anthropometric parameters, lipidogram, glycemic profile, brachiocephalic arteries (BCA) ultrasound (USD), and heart structural and geometric parameters according to echocardiography (EchoCG) and coronary calcium (CC) parameters was performed.
Results: Patients with CHD and NAFLD had statistically significantly higher levels of total cholesterol, very low-density lipoproteins, triglycerides, insulin, heart structural parameters, and CC.
Conclusions: Thus, the relationship between NAFLD and CHD is two-way, and liver diseases can exacerbate the course of cardiovascular diseases (CVD).
Cardiovascular diseases (CVD) are the leading cause of death in the world and account for over 17.5 million deaths per year. Among CVD in the structure of population mortality, coronary heart disease (CHD) occupies the first place [1]. The high mortality rates from CVD are largely due to the insufficient effectiveness of preventive measures aimed at preventing cardiovascular complications. This is due to the difficulties in the timely identification of individuals with a high individual risk of CVD. The main focus in preventing diseases and complications is identifying and correcting risk factors (RFs) [2]. Non-alcoholic fatty liver disease (NAFLD) is considered one of the RF for the development of CHD [3]. The commonality of the pathogenetic links of CVD and NAFLD allows us to consider NAFLD as an RF and, possibly, a marker of a prognostically unfavourable course of CVD, particularly CHD.
Currently, there is increasing evidence supporting the concept of a bidirectional relationship between NAFLD and various components of the pathogenesis of CHD, with insulin resistance (IR) being one of the central pathophysiological processes. IR plays a key role in the development of steatosis. Peripheral IR is associated with the development of hyperglycemia and/or hyperinsulinemia. Hyperinsulinemia and the frequent activation of the sympathoadrenal system in obesity lead to enhanced lipolysis in adipose tissue, resulting in the release of increased amounts of free fatty acids, while their oxidation rate in the liver decreases. The increased influx of free fatty acids to the liver and their inadequate oxidation contribute to the excessive accumulation of triglycerides in hepatocytes and the secretion of large amounts of very low-density lipoproteins (VLDLs). Activated macrophages migrate to these areas, releasing cytokines through phagocytosis and primarily triggering delayed-type immune responses, which leads to chronic systemic inflammation. This increases the risk of CVD, possibly through activation of the sympathetic nervous system. Additionally, patients with NAFLD, alongside prolonged hypertriglyceridemia, may experience postprandial hyperlipidemia, which is associated with postprandial atherogenesis, further elevating the risk of CVD. In conditions of increased free fatty acid influx to the liver, the accumulation of reactive oxygen species rises, leading to a cellular deficiency of adenosine triphosphate, activation of lipid peroxidation, and the development of oxidative stress. Studies indicate that oxidative stress may also be involved in the pathogenesis of CVD in patients with NAFLD. Pathogenetically, NAFLD is linked to increased components of the renin-angiotensin system, such as angiotensin II, which may contribute to vascular damage by enhancing oxidative stress, subsequently impairing insulin signalling pathways, and accelerating atherosclerosis development. Furthermore, impaired insulin signalling in the endothelium leads to vasoconstriction, thereby contributing to the development of arterial hypertension (AH). Angiotensin II also accelerates the progression of NAFLD to non-alcoholic steatohepatitis (NASH) and then to fibrosis by stimulating fibroblasts and inducing the release of proinflammatory cytokines. Based on the shared pathogenesis of NAFLD and CVD, it can be concluded that they mutually influence each other’s development and prognosis [4–6].
The study aimed to compare the cardiovascular system (CVS) and metabolic profile parameters in patients with CHD with and without NAFLD.
The study prospectively included 85 patients with CHD FC II-III (according to the Canadian Cardiovascular Society) with and without NAFLD who voluntarily signed informed consent for inclusion in the study. Of these, 61 patients with CHD and NAFLD (group I) and 24 patients with CHD without NAFLD (group II) were aged 45 to 75. The gender and age of the patients are shown in Table 1.
Characteristics of the patients
| Indicator | Group I (n = 61) | Group II (n = 24) | p | |
|---|---|---|---|---|
| Age, years (mean ± SD) | 61.4 ± 9.1 | 62.2 ± 10.9 | 0.2556 | |
| Gender | Men | 22 (36%) | 11 (45.8%) | 0.2429 |
| Women | 39 (64%) | 13 (54.2%) | ||
SD: standard deviation
A thorough medical history was collected in all patients, RFs were identified, anthropometric parameters (weight, height, and waist size), physical examination data were studied, and laboratory and instrumental studies were performed [lipid and glycemic profile, brachiocephalic arteries (BCA) ultrasound (USD), echocardiography (EchoCG), and computed tomography (CT) with calculation of coronary calcium (CC)]. USD examination of BCA was performed on a SIEMENS ACUSON X700 USD system (Germany) with a 7 MHz linear transducer. EchoCG was performed on ‘En VisorC’ (PHILIPS, the Netherlands) in accordance with the recommendations of the American Association of EchoCG in M- and B-modes. CC was assessed using computer tomograph Ingenuity Core, PHILIPS 64 (the Netherlands).
The diagnosis of CHD was verified by coronary angiography.
The diagnosis of NAFLD was established using an USD examination of the liver, performed on an empty stomach by a single specialist, using the same equipment and consistent diagnostic criteria. USD signs of NAFLD: diffuse hyperechogenicity and heterogeneity of the liver parenchyma structure, indistinct or enhanced visibility of the vascular pattern, and distal attenuation of the echo signal. USD examination of the liver was performed utilizing PHILIPS Affiniti 70 USD system (the Netherlands).
The obtained results were processed using the GraphPad Prism 10.1.1 statistical program (Inc. La Jolla, CA, USA) and Microsoft Office Excel 2013. The data obtained were M ± SD (M is the arithmetic mean and SD is the standard deviation). p < 0.05 was considered statistically significant. To compare normally distributed quantitative variables in two groups, an unpaired Student’s t-test was used. For the analysis of contingency tables to compare proportions, the Pearson chi-square test was applied.
Both groups were representative in terms of gender and age (Table 1). According to anamnestic data, the frequency of past cardiovascular events and comorbidities did not significantly differ between the patients in the studied groups.
The analysis of the identified RFs in patients with CHD with/without NAFLD is presented in Table 2. In both groups, the most common RFs were hypertension (in group I—100%, in group II—70.8%; p < 0.0001) and dyslipidemia (DLP; in group I—78.7%, in group II—62.5%; p = 0.1692). In patients with NAFLD, obesity, hypertension, and type 2 diabetes mellitus (T2DM) were significantly more common than in patients without NAFLD.
Analysis of the studied risk factors in both groups
| Indicator | Group I (n = 61) | Group II (n = 24) | p |
|---|---|---|---|
| Arterial hypertension | 61 (100%) | 17 (70.8%) | < 0.0001* |
| Dyslipidemia | 48 (78.7%) | 15 (62.5%) | 0.1692 |
| Type 2 diabetes melitus | 25 (41%) | 3 (12.5%) | 0.0196* |
| Glucose intolerance | 6 (9.8%) | 4 (16.7%) | 0.4581 |
| Obesity | 41 (67.2%) | 0 | < 0.0001* |
| Smoking | 16 (26.2%) | 5 (20.8%) | 0.096 |
*: p < 0.05
Hypertension was diagnosed in all patients in group I, whereas in group II, 29.2% of patients did not suffer from hypertension. In both groups, grade 1 hypertension was more often detected. Systolic blood pressure (SBP) and diastolic blood pressure (DBP) levels were significantly higher in group I (Table 3). Analysis of clinical symptoms showed that the majority of patients had clinical manifestations of the disease corresponding to FC III stable angina pectoris, while in group I, significantly more often than in group II. There was a statistically significant difference in the duration of the ischemic anamnesis (p = 0.036), but not in the duration of hypertension (p = 0.092). The clinical characteristics of the groups according to FC of angina pectoris and degree of hypertension are presented in Table 3.
Analysis of the occurrence of functional classes of angina pectoris and the degree of AH in both groups
| Indicator | Categories | Group I (n = 61) | Group II (n = 24) | p |
|---|---|---|---|---|
| Angina pectoris (FC) | II FC | 11 (18%) | 10 (41.7%) | 0.0479* |
| III FC | 50 (82%) | 14 (58.3%) | ||
| AH grade | NBP | 0 | 7 (29.2%) | < 0.001*χ2 = 20.428 |
| Grade 1 | 38 (62.3%) | 12 (50%) | ||
| Grade 2 | 12 (19.7%) | 2 (8.3%) | ||
| Grade 3 | 2 (3.3%) | 0 | ||
| Achieved normotension | 9 (14.8%) | 3 (12.5%) | ||
| SBP, mmHg | 127.3 ± 7.4 | 117.9 ± 5.6 | < 0.0001* | |
| DBP, mmHg | 79.8 ± 3.4 | 75.4 ± 4.6 | 0.0014* | |
| Duration of AH, years | 14.5 ± 6.2 | 12.6 ± 8.8 | 0.092 | |
| Duration of CHD, years | 10.9 ± 4.3 | 6.1 ± 3.2 | 0.036* | |
| Angina episodes per week | 2.1 ± 0.8 | 0.8 ± 0.3 | 0.0023* | |
*: p < 0.05. AH: arterial hypertension; CHD: coronary heart disease; DBP: diastolic blood pressure; NBP: normal blood pressure; SBP: systolic blood pressure
Patients in the studied groups differed significantly in body mass index (BMI): in group I, this indicator was 33.3 ± 5.8 kg/m2, and in group II, 25.2 ± 2.0 kg/m2 (p < 0.0001). Waist circumference (WC), a parameter of abdominal obesity, was also assessed. In both groups, WC was higher than normal for both men (> 94 cm) and women (> 80 cm), in group I, this indicator was significantly higher for both sexes. Even though obesity was not observed in group II, WC, which better demonstrates the distribution of body fat, was higher than normal. The anthropometric indicators in the studied groups are presented in Table 4.
Anthropometric characteristics of the patients
| Indicator | Group I (n = 61) | Group II (n = 24) | p | |
|---|---|---|---|---|
| BMI, kg/m2 | 33.3 ± 5.8 | 25.2 ± 2.0 | < 0.0001* | |
| WC, cm | Men | 109.6 ± 7.2 | 98.5 ± 9.1 | < 0.01* |
| Women | 96.8 ± 8.3 | 87.4 ± 6.9 | < 0.001* | |
*: p < 0.05. BMI: body mass index; WC: waist circumference
The lipidogram and glycemic profile were evaluated in both groups, followed by a comparison of the data (Table 5).
Lipid and glycemic profiles in both groups
| Indicator | Group I (n = 61) | Group II (n = 24) | p |
|---|---|---|---|
| Total cholesterol, mg/dL | 192 ± 6.5 | 163.6 ± 13.7 | 0.0091* |
| LDL, mg/dL | 102.2 ± 7.4 | 93.3 ± 15.7 | 0.2482 |
| HDL, mg/dL | 42.5 ± 8.6 | 45.2 ± 9.3 | 0.4727 |
| VLDL, mg/dL | 44.7 ± 5.4 | 22.6 ± 11.2 | < 0.0001* |
| Triglycerides, mg/dL | 224.4 ± 36.2 | 112.7 ± 21.6 | 0.0003* |
| Fasting glucose, mmol/L | 6.0 | 5.5 | 0.4214 |
| HbA1С, % | 7.9 | 7.0 | 0.7477 |
| Insulin, µIU/mL | 15.4 | 4.9 | 0.0035* |
| HOMA-IR | 3.9 | 1.9 | 0.1466 |
*: p < 0.05. HbA1С: glycated hemoglobin; HDL: high-density lipoprotein; HOMA-IR: Homeostatic Model Assessment for Insulin Resistance; LDL: low-density lipoprotein; VLDL: very low-density lipoprotein
Analysis of the lipidogram data showed that lipid metabolism disorders were observed in both groups, while the levels of total cholesterol, VLDL, and triglycerides were significantly higher in individuals with CHD and NAFLD. Interestingly, low-density and high-density lipoproteins did not significantly differ although “lipid triad” changes were expected in patients with NAFLD.
Glycemic levels in both groups did not differ statistically, although T2DM was significantly more common in group I. Nonsignificant changes in fasting glucose and HbA1C levels can be explained by tight glycemic control in patients with T2DM. Basal insulin levels differed significantly in both groups. The value of (Homeostatic Model Assessment) HOMA-IR > 2.5 was regarded as the presence of IR in the patient. The analysis revealed that group I patients had IR, although there was no significant difference in HOMA-IR in the studied groups.
According to the results of the analysis of atherosclerotic lesions of the carotid canal using duplex BCA scanning, local thickening of the intima-media thickness (IMT) of the common carotid artery (CCA) was found in patients with CHD in both groups. There was no significant difference in IMT in groups I and II. In group I, the IMT was 1.1 ± 0.2 mm, and in group II, 1.1 ± 0.05 mm (p = 0.6724). When analysing the degree of BCA stenosis, duplex scanning revealed more pronounced atherosclerotic changes characteristic of patients in group I.
The proportion of patients with atherosclerotic plaque in BCA in groups I and II was 75.4% and 54.2%, respectively. The proportion of patients with hemodynamically insignificant stenosis (< 50%) in group I was 50.8%, in group II—45.8%, while hemodynamically significant stenosis was observed in 24.6% of patients in group I and 8.4% in group II.
We studied the structural and geometric parameters of the heart according to EchoCG data in patients with CHD with/without NAFLD. Among all the studied indicators, there were significant differences in the compared groups between end-diastolic volume (EDV), end-systolic volume (ESV), end-diastolic size (EDS), end-systolic size (ESS), and left ventricular mass (LVM) (Table 6, Figure 1). The thickness of the left ventricle (LV) walls was increased in patients with NAFLD, although there were no significant differences.
Echocardiographic parameters in both groups
| Indicator | Group I (n = 61) | Group II (n = 24) | p | |
|---|---|---|---|---|
| EF, % | 59.1 ± 6 | 59.5 ± 2.8 | 0.8958 | |
| EDV, mL | 109.2 ± 28.5 | 80.8 ± 10.3 | 0.0156* | |
| ESV, mL | 46.4 ± 13.7 | 32.7 ± 5.8 | 0.0293* | |
| IVST, cm | 1.1 ± 0.1 | 1.0 ± 0.06 | 0.1116 | |
| PWT, cm | 1.0 ± 0.08 | 0.9 ± 0.05 | 0.1502 | |
| EDS, cm | 5.0 ± 0.5 | 4.5 ± 0.2 | 0.01* | |
| ESS, cm | 3.5 ± 0.6 | 2.9 ± 0.2 | 0.0295* | |
| LVM, g | 202.5 ± 51.7 | 150.8 ± 20.4 | 0.025* | |
| LVM, g/m2 | 100.0 ± 11.0 | 89.1 ± 10.4 | 0.3115 | |
| RWT | 0.42 ± 0.08 | 0.39 ± 0.06 | 0.35 | |
| E/A | 0.9 ± 0.3 | 0.89 ± 0.14 | 0.9762 | |
| Cardiac hypertrophy | Yes | 18 (29.5%) | 7 (29.2%) | < 0.999 |
| No | 43 (70.5%) | 17 (70.8%) | ||
| Dilation of the chambers | Yes | 11 (18%) | 4 (16.7%) | 0.6413 |
| No | 50 (82%) | 20 (83.3%) | ||
| Impaired contraction | Yes | 15 (24.6%) | 3 (12.5%) | 0.3198 |
| No | 46 (75.4%) | 21 (87.5%) | ||
| LV diastolic dysfunction | Yes | 43 (70.5%) | 16 (66.7%) | 0.7079 |
| No | 18 (29.5%) | 8 (33.3%) | ||
*: p < 0.05; E/A: the ratio of the early (E) and late (A) diastolic mitral inflow velocity. EDS: end-diastolic size; EDV: end-diastolic volume; EF: ejection fraction; ESS: end-systolic size; ESV: end-systolic volume; IVST: interventricular septum thickness; LV: left ventricle; LVM: left ventricular mass; PWT: posterior wall thickness; RWT: relative wall thickness
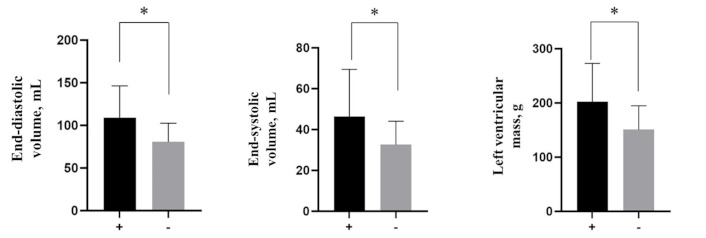
Echocardiographic parameters in both groups. +: CHD with NAFLD; -: CHD without NAFLD. *: p < 0.05. CHD: coronary heart disease; NAFLD: non-alcoholic fatty liver disease
According to the CT data, the presence of atherosclerotic lesions in the coronary bed was assessed using the CC index (CC; Figure 2). CC was significantly higher in group I [236.83 ± 84.3 Hounsfield units (HU)] than in group II (24.8 ± 19.6 HU; p = 0.0074).
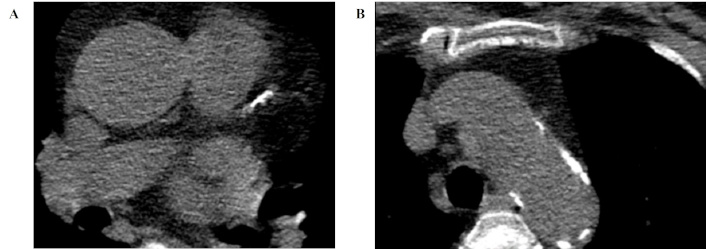
An example is a 70-year-old woman with coronary heart disease and non-alcoholic fatty liver disease. Transverse CT images, 1 mm reconstruction slice thickness. The calcified plaques are located in the left anterior descending artery (A) with the total coronary calcium score of 483.9 HU and calcification in the ascending aorta (B) of 33.4 HU. CT: computed tomography; HU: Hounsfield units
The results obtained in our study are consistent with the results of large studies comparing cardiovascular parameters in patients with/without NAFLD [7–12]. A study [7] investigated the relationship between the degree of coronary artery calcification and the presence of NAFLD in patients with metabolic syndrome, demonstrating that patients with NAFLD had significantly higher coronary artery calcification levels than patients without NAFLD. A higher degree of coronary artery calcification was associated with more pronounced lipid metabolism disorders and IR, which are common to NAFLD and atherosclerosis. Another study [8] demonstrated that patients with CHD and NAFLD had a more pronounced thickening of the carotid arteries’ intima-media than patients without NAFLD. NAFLD has been associated with elevated LDL and triglyceride levels, as well as an imbalance in lipid metabolism, which accelerates the development of carotid artery atherosclerosis.
Special attention should be paid to LV remodelling against the background of NAFLD according to EchoCG data. Studies have shown that NAFLD can affect the CVS, leading to changes such as thickening of the heart walls, increased myocardial mass, impaired diastolic function, and other cardiovascular problems [9–12]. Thus, NAFLD can lead to functional and structural changes in the heart, increasing the risk of CVD. These data largely coincide with the results of our study, in which patients with CHD and NAFLD had a higher structural parameter, and the difference between the groups was significant.
The limitations of our study were the small sample size and the different number of patients in both groups. In addition, we did not evaluate how the severity of steatosis and fibrosis measured by transient elastography correlates with the manifestations and course of CHD. A valuable addition to the study would be evaluating the prognosis in patients with CHD with/without NAFLD, as numerous studies have demonstrated a worse prognosis in patients with CHD on the background of NAFLD.
To summarize, we can say that the relationship between NAFLD and CHD is two-way and liver diseases can exacerbate the course of CVD. However, despite a large number of studies, there are gaps regarding the possible association between the presence of NAFLD and cardiovascular parameters in cardiac pathology. This confirms that real clinical practice needs to deepen knowledge about the mutual effects of these pathologies and develop algorithms for monitoring such comorbid patients.
BCA: brachiocephalic arteries
CC: coronary calcium
CHD: coronary heart disease
CT: computed tomography
CVD: cardiovascular diseases
CVS: cardiovascular system
EchoCG: echocardiography
HOMA: Homeostatic Model Assessment
HU: Hounsfield units
IMT: intima-media thickness
IR: insulin resistance
LV: left ventricle
NAFLD: non-alcoholic fatty liver disease
RFs: risk factors
T2DM: type 2 diabetes mellitus
USD: ultrasound
VLDLs: very low-density lipoproteins
WC: waist circumference
DBY: Conceptualization, Investigation, Writing—original draft. RBA: Conceptualization, Writing—review & editing, Supervision. UIN: Investigation, Writing—review & editing, Supervision. ABS: Writing—review & editing, Supervision. SA: Conceptualization, Investigation. NN: Writing—review & editing, Supervision. SMS: Conceptualization, Writing—original draft. All authors read and approved the submitted version.
The authors declare that they have no conflicts of interest.
The study was approved by the Republican Specialized Scientific and Practical Medical Center of Cardiology Ethics Committee (approval number № 2) and complies with the Declaration of Helsinki.
Informed consent to participate in the study was obtained from all participants.
Informed consent to publication was obtained from relevant participants.
The data for this study could be available from the corresponding authors upon reasonable request.
Not applicable.
© The Author(s) 2025.
Open Exploration maintains a neutral stance on jurisdictional claims in published institutional affiliations and maps. All opinions expressed in this article are the personal views of the author(s) and do not represent the stance of the editorial team or the publisher.
Copyright: © The Author(s) 2025. This is an Open Access article licensed under a Creative Commons Attribution 4.0 International License (https://creativecommons.org/licenses/by/4.0/), which permits unrestricted use, sharing, adaptation, distribution and reproduction in any medium or format, for any purpose, even commercially, as long as you give appropriate credit to the original author(s) and the source, provide a link to the Creative Commons license, and indicate if changes were made.

View: 1741
Download: 104
Times Cited: 0
